
Whatever programming language you use, sooner or later you will want to find out what happens in your program at runtime. The objectives of obtaining such information may differ from developer to developer and from user to user, but whatever the objective one thing remains consistent - you will need the logs of your program to achieve it. Like many before us, we experienced this need.
Considering the fact that all of our almost-monolithic applications run inside docker containers, at first, work was organized to collect logs from these containers.
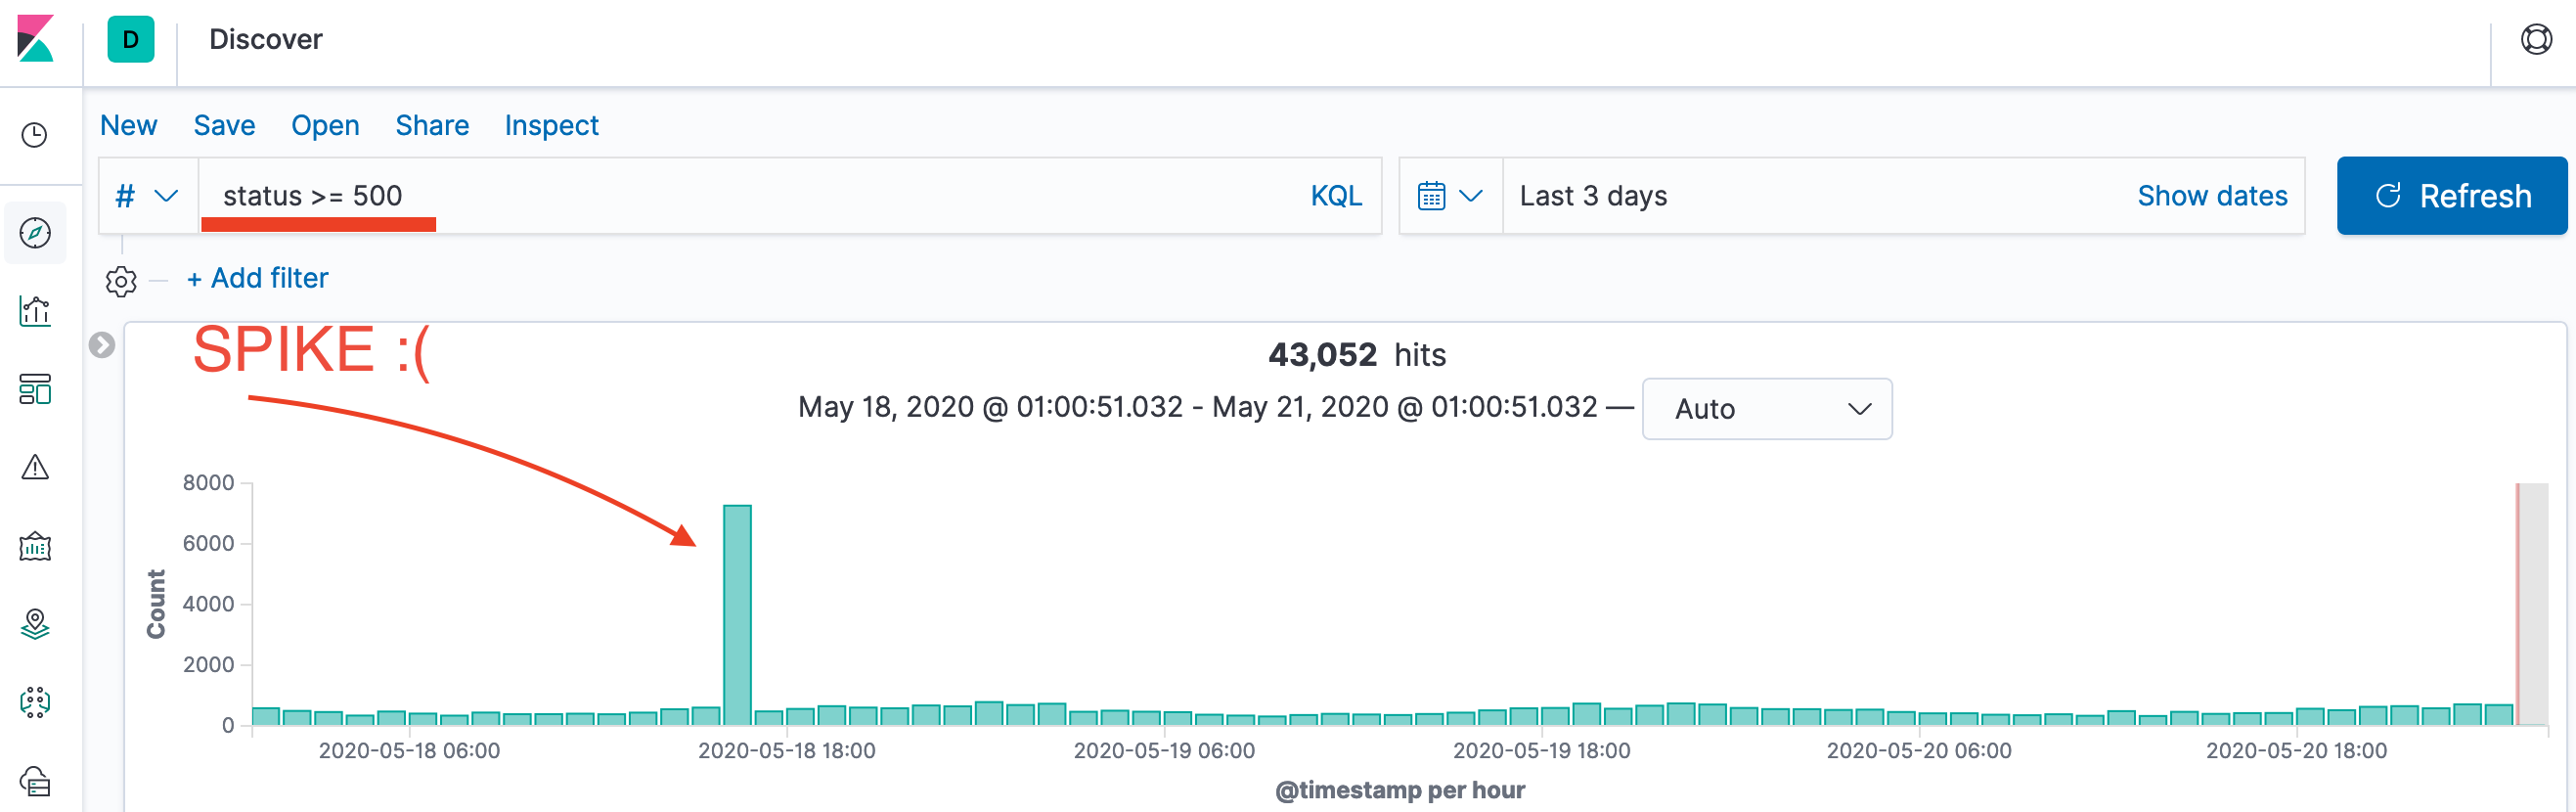
A critical requirement for collecting logs was the need for an aggregate search when responding to incidents - ddos attacks, abnormal user behavior, error spikes given to mobile applications, and research on penetration attempts. What free solution can beautifully display our logs at consecutive intervals? We settled on ElasticSearch along with Kibana, which provides out-of-the-box fast aggregate searches within consecutive time intervals.
When inserting non-single records in ElasticSearch, ElasticSearch insists on inserting data with a large set of records (batches) in the format that ElasticSearch defines.

As you can see in the picture above, we know the sending point and the destination point of our structured messages (logs). And we want to minimize the number of programs that will convert message formats - from docker-container to the message set format that ElasticSearch requires.
Elasticsearch for such cases has a special solution - Logstash, thus forming the famous ELK abbreviation (Elasticsearch, Logstash, Kibana).
Among the possible solutions for integrating Logstash together with docker in the documentation we can find the GELF (graylog extended format logging) message format. Let's look at the final log transfer stream.

Inside the docker containers there is a web application written in ruby (best language in the world, btw) that processes each request in a separate thread. To prevent slow clients from slowing down application threads, we, like many, use nginx. Therefore, we would also like to receive request logs from nginx.

This stack is relatively quick to configure, without blocking the continuous improvements that are still required.
Logging 2.0
There were several issues with configured logging 1.0.:
- when reconfiguring Logstash, we lost logs
- when reconfiguring ElasticSearch, we lost logs
- during abnormal work of ElasticSearch, we lost logs
The need for long-term storage of logs while maintaining the highest possible availability forced us to search for the ideal application logging scheme.
Gathering requirements
- availability in case of emergency
In any emergency mode, it is important for us to be able to find the cause of the problem. It's impossible to do this without the logs. - reliability in normal operation
in normal mode, we would like to have reliable log delivery, so that looking at the logs according to certain criteria, we can always easily find them and not think why they disappeared, and sometimes they disappeared. - short time management
On average, we have 1M active users per backend developer, and it is more profitable for a business to spend our time developing user features than supporting infrastructure (for example, restoring a cluster after unexpected error) - business doesn't like vendor-locks
- cost
System architecture
The first reflex thought that appears in the head when required to provide maximum availability.

We put a balancer in front of Logstash (haproxy or a ready-made aws solution if you are inside aws), instead of a single elasticsearch instance, we make an elasticsearch cluster. But in this scenario, we begin to pay at least x2 for processing logs, and this comes on top of our reconfiguration and maintenance efforts. So, we increase availability, but somehow it is rapidly becoming very expensive. What do we do?

Maybe we should look at ready-made solutions? Here is the list of tools we considered at least in passing:
- Riemann
- SaaS log management
- cloudwatch(AWS)
- kinesis(AWS)
- DataDog
- fluentd
- heka, logstash
- rsyslog, syslog-ng
- there was probably something else
And this the moment when one realises the value of having very smart colleagues who are there to challenge and to help you. The proposed solution turned out to be so concise, simple and amazing that one doesn't immediately realize all of its beauty.

Let's just write to files, then we can ensure the availability of logs at critical moments, with the advantages of the existing solution.
You can write to files on the local instance and send all the information to a remote machine at the same time. Therefore, the "Magic Solution" in the general case, we had as follows.

In emergency situations, we can always make 'grep' and find the source of an emergency, even if the main log collector stops working for us (we provide availability).
But here we recall that Logstash can take logs from files, watching for changes in them. Thus, we can do this and, at a minimum, get rid of the need for a balancer and Elasticearch cluster (the cost criteria is still important for us).

And then the question arose: did people really not solve such problems with centralizing file logs before, because we all know that on Linux all logs are in /var/log. This means that earlier developers and administrators had problems collecting and sending them to a centralized log server.
After an extended study of probably the longest-lasting open source project in logging systems - rsyslog, it became clear that it could easily replace Logstash and our logging system could be made exceptionally simple. But for a start, we had a smooth transition to logging 2.0
So we got to the architecture, where on each instance there will be a local rsyslog log collector that sends logs to the central rsyslog server, which in the future can write logs to files and Elasticsearch at the same time. And it seems that this satisfies all our requirements that we set for the logging system.
To test the solution’s health, we decided to test rsyslog to collect all the logs from our instances, and we have up to 150 of them. It looked like enough to test the health of the whole solution. If the solution justifies itself, then at the same time we will still be able to centralize the collection of logs from instances so that it is possible to resolve incidents during the upcoming autoscaling.
After testing and the final transition, our log collection system was completely transformed and met all the requirements that we presented to it.

In further articles I will talk about why rsyslog satisfies our reliability requirement, about rsyslog inter-server communication, and also look at how logs are transferred inside Linux from byte to byte and, of course, configuration of rsyslog.
I hope that after reading a series of articles on centralizing logs, you can do it faster, cheaper, more reliable, and without losing availability.
Conclusion
After reading the article, it may seem that at some point I picked up the logging system and did everything alone, but this is far from the case.
In the process of moving to our ideal logging system, we constantly discussed the pros and cons of different solutions, and each of us defended the requirement close to them or changed the configuration parameters they needed, asked intriguing questions or sent us back to the original set of requirements.
In conclusion, I want to thank my colleagues for a creative atmosphere and for their advice and hand-on help which allowed us to create such a system together.